B5 — 報表與 KPI
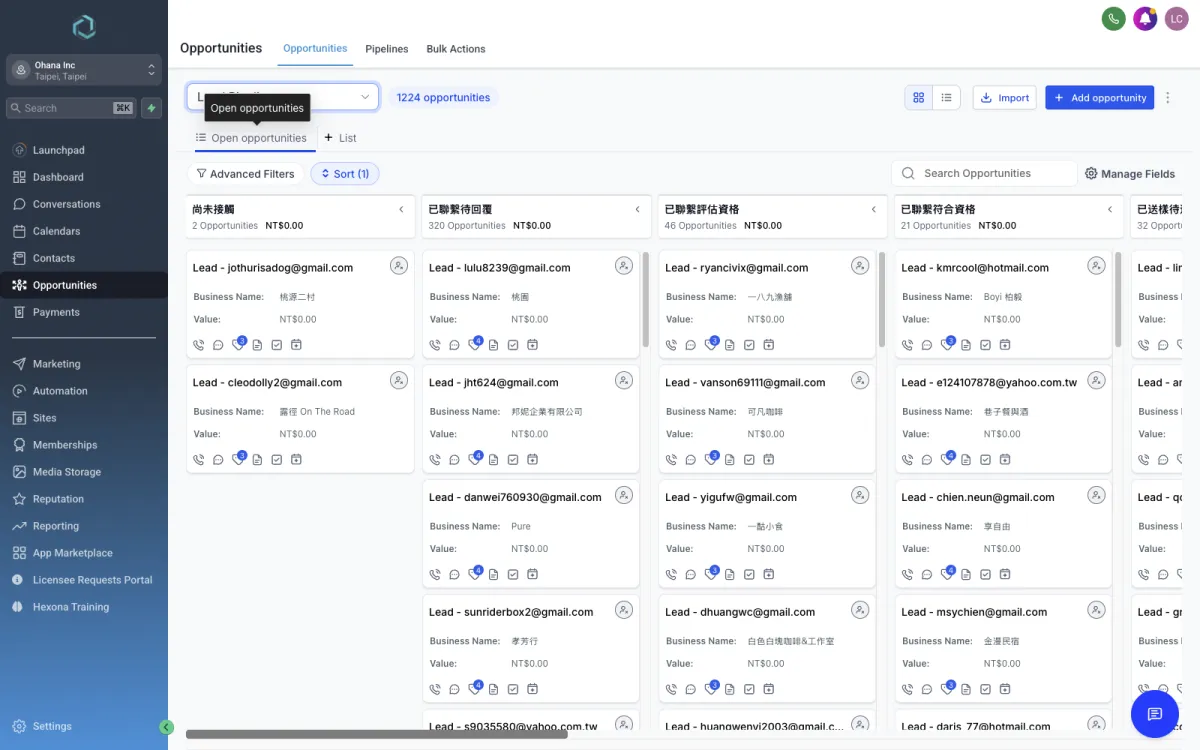
B5.1 KPI 對應表
| KPI | 看哪 | 計算方式 |
|---|---|---|
| Lead 轉換率 | Opportunities → Lead Pipeline | Won 階段卡數 / 全 pipeline 卡數;Won 階段已校正用 lifetime_spend_twd 計值 |
| AR 帳齡分布 | Opportunities → AR Tracker | 各帳齡階段的卡數 + 金額小計(GHL 看板頂端有顯示) |
| 本月 SHOPLINE 營收 | (自行加總) | 所有 contact 的 lifetime_spend_twd 漸增量;或 n8n 內加總 order 金額 |
| 業務個人績效 | Contacts → Filter by 業務負責人 | 該 owner 的成交數 / 樣品轉換率 / AR 收回率 |
| 各品牌出貨量 | AR Opportunities → Filter brand | 分群加總「數量_箱」 |
B5.2 GHL Reporting
左側選單 → Reporting → 5 個 tab:
- Reports — Funnel / Opportunity Status / Source / Sales 等預設 dashboard
- Google Analytics — 沒接
- Facebook Ads — 沒接
- Google Ads — 沒接
- Call Reporting — 沒用
GHL 預設 Reporting 對 Lead Pipeline 轉換率夠用;AR 報表要靠 AR Tracker 看板的階段金額小計。如果要更細(月份趨勢、業務排行),需要自己用 API 拉資料到 Google Sheets / Looker Studio。
B5.3 累計消費額的口徑
每位 contact 的 lifetime_spend_twd 欄位 = SHOPLINE 歷史所有 paid 訂單 total 加總(含稅含運)。由 n8n 在每筆訂單同步時更新。
- 2026-05-21 歷史回補時 GHL 全部歷史總消費額 ≈ NT$13.27M(794 個真實客戶,3,107 筆訂單)
- Lead Pipeline Won 階段卡片金額 = 該 contact 的
lifetime_spend_twd
B5.4 想看更深的數字
GHL UI 報表力有限。要看跨期趨勢 / 業務歸戶 / 品項分析,選擇:
- API
GET /contacts/撈所有 contact 帶累計消費 → 匯出 CSV → Excel pivot - 寫 n8n flow 每月 1 號 cron snapshot 累計消費到 Google Sheets
- (將來)接 Looker Studio / Metabase
